Fermi LAT Performance |
This page summarizes the top-level performance descriptions of the Fermi-LAT observatory that are currently used by the collaboration for science analysis and are available to the general public.
The LAT performance is governed primarily by three things:
- LAT hardware design
- Event reconstruction algorithms
- Background selections and event quality selections
A result of the analysis is the production of full Instrument Response Functions (IRFs), describing the performance as a function of photon energy, incidence angle, conversion point within the instrument, and other important parameters.
P7_V6 Instrument Response Functions
The plots below represent the work of many people in the LAT team. They correspond to the status of the analysis known as P7SOURCE_V6, which has been optimized for the study of point-like sources and the production of the second LAT source catalog (2FGL).
These IRFs are based on updated event analysis and selection criteria that take into account effects measured in flight that were not considered in pre-launch performance estimates (Pass6_V1). The effects were primarily pile-up and accidental coincidence effects in the detector subsystems leaving ghost signals in the detector in coincidence with good photon triggers. An updated version of the IRFs (Pass6_V3) distributed with the original public release of Fermi data did take those effect into account, but did not attempt to re-optimize the event selection in light of the knowledge gained in flight.
In order to include the effects of ghost signals in our simulations and appropriate sampling of flight data periodic triggers was overlayed as a background to standard simulations of gamma-rays.
For more details, please refer to the paper Post-launch performance of the Fermi Large Area Telescope.
Important caveats are associated with these IRFs and should be kept in mind when performing analysis of the publicly distributed Fermi-LAT data.
Effective Area, Point Spread Function and Energy Resolution
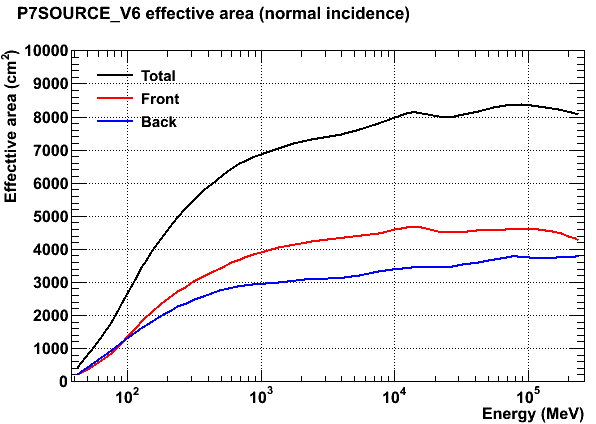
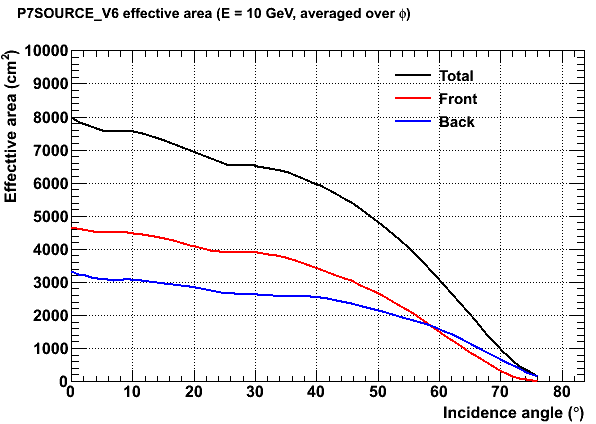
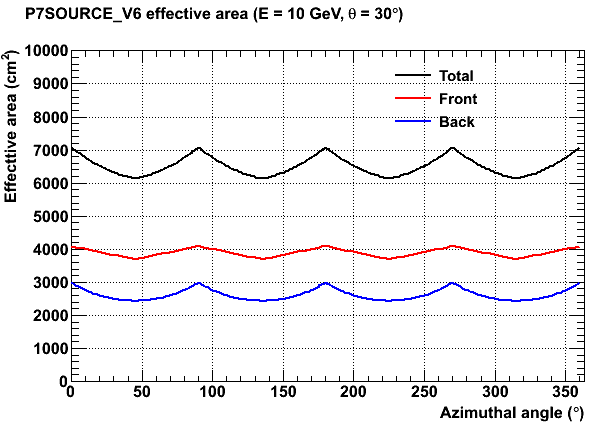
Note: Starting from the front of the instrument, the LAT tracker (TKR) has 12 layers of 3% radiation length tungsten converters (THIN or FRONT section), followed by 4 layers of 18% r.l. tungsten converters (THICK or BACK section). These sections have intrinsically different PSF due to multiple scattering, and the performance plots are presented for both of these sections.
Effective Area: The plot on the left is for normal incidence photons (defined here as "cos(theta)>0.975"); the one on the right is for 10 GeV photons as a function of incidence angle.
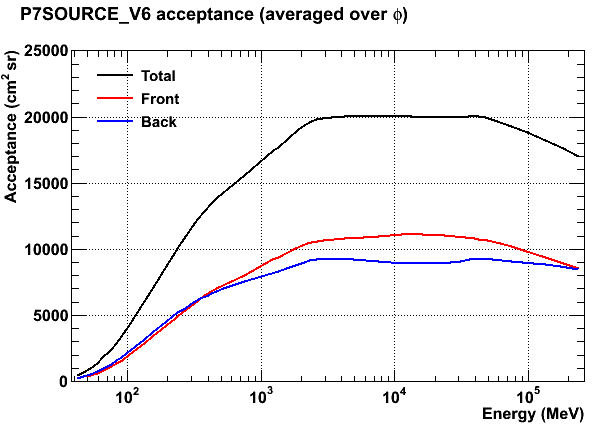
Acceptance: Defined here as the effective area integrated over the solid angle. Notice that the acceptance has a slower turn-on wrt the effective area, highlighting the dependence of the FOV on energy. That is the intrinsic acceptance regardless of the orbital characteristics. To obtain the effective acceptance, the curve has to be scaled by a constant factor which takes into account the instrument deadtime; the South Atlantic Anomaly (SAA), where the LAT does not take data; and details of the observation strategy (about 20% for standard survey and according to current simulations).
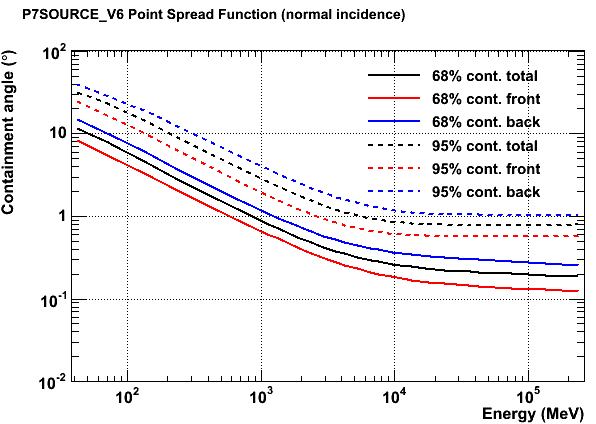
Point Spread Function (PSF): Angles for 68% and 95% containment of the reconstructed incoming photon direction.
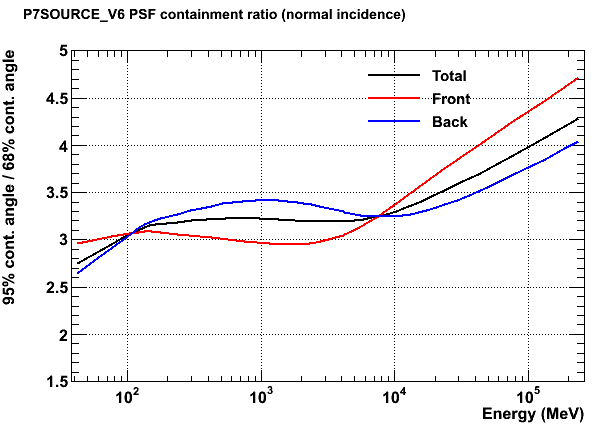
The ratio PSF95% / PSF68% is a useful indicator of the magnitude of the tails of the distribution. Plots are as defined above.
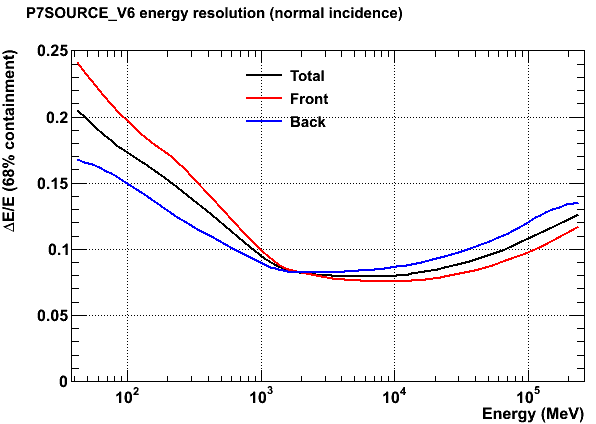
Energy resolution: 68% containment of the reconstructed incoming photon energy. The plot on the left is for normal incident photons (defined as "cos(theta)>0.9"); the one on the right is for 10 GeV photons as a function of incidence angle.
Point Source Sensitivity Plots
Using the above instrument performance characterization, we have produced a map showing the sensitivity at various positions in the sky for a point source with a 1/E^2 spectrum. The color scale shows the required F[E>100 MeV] in ph cm -2 s -1 to reach our detection limit likelihood test statistic of 25, based on 24 months of operation in survey mode. To make this figure we used the isotropic diffuse emssion template available via the FSSC. This plot also accounts for the significant variations of the sensitivity due to the spatial structure in the diffuse galactic gamma-ray background, for which we used the galactic diffuse model which is also available via the FSSC.

Gamma-ray Bursts Sensitivity
An estimator for the Localization power as a function of the fluence is plotted in the graph below.
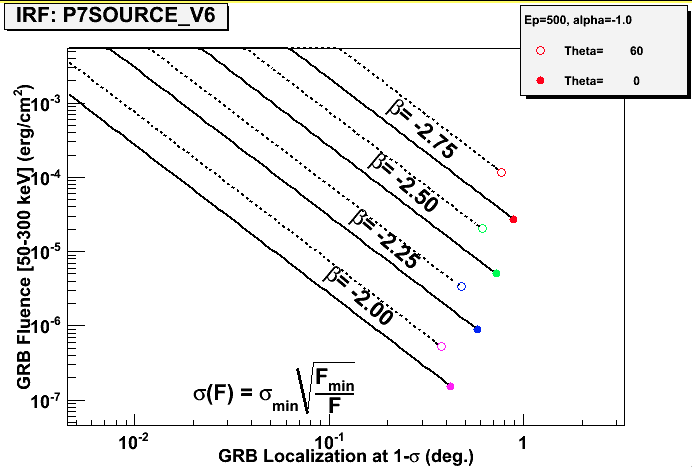
Each marker corresponds to a different inclination angle and a different high energy spectral index, and represents the minimum fluence (in the standard 50 keV-300 keV energy band), which corresponds to a detection (y-axis) vs the 68% localization accuracy (x-axis). The solid and dotted lines are the result of the formula shown on the canvas, and allow computation of the localization at a given fluence (for normal incidence and for 60 degrees off-axis).
If there is any additional information you would find useful to have posted on this page, please contact Julie McEnery and/or the LAT Analysis Coordinator, Gino Tosti.
Fermi LAT performance updates and archive
Performance updates are expected in the second year for:
- Mapping the orbital dependence of the pileup effect, which varies with the incoming particle trigger rate.
- Recovering the instrument acceptance after proper correction of the event reconstruction and background rejection analysis based on update simulations as described above.
Earlier performance descriptions are archived; see: Pass6_V3,Pass6_V1. Science performance requirements for the LAT are given in Table 1 of the Science Requirements Document.
The Fermi data and the full set of response functions and Science Analysis Tools can be downloaded from the Fermi Science Support Center website's Data Section.
Useful links:
- LAT Home Page
- LAT Design, Development, and Operations Page
- Fermi Mission
- Fermi Science Support Center
- Fermi Users Group
- GBM Home Page
Updated on August 12, 2011, maintained by Riccardo Rando (riccardo.rando@pd.infn.it), Eric Charles (echarles@slac.stanford.edu), and Seth Digel (digel@slac.stanford.edu).