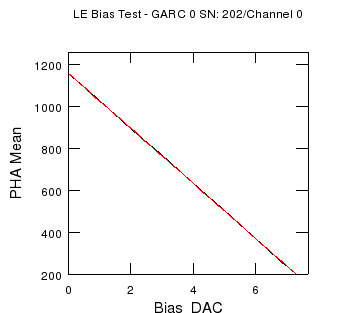
Plot of values
Comments
Plot of diff W.R.T. reference
This plots is for high range readout
Range: 0 - 2000
This plots is for high range readout
Range: -150 - -110
100 pha counts
This plots is for high range readout

This plots is for low range readout
Range: 0 - 2000
This plots is for low range readout
Range: -150 - -110
100 pha counts
This plots is for low range readout
100 pha counts for both ranges.